Running a business without the right data is like driving with your eyes closed. One of our retail clients was struggling to understand why their profits were lagging despite decent sales figures. When we looked at their sales reports, we realized certain high-cost items were dragging down their profit margins. By tweaking their pricing strategies based on the Sales by Product Report, they saw a noticeable improvement in just a month.
Let’s dive into the ten essential sales reports IK Tech’s Point of Sale (POS) system should generate and how they can transform your business.
WHAT IS A SALES REPORT?
A sales report is a detailed record of your business’s sales activities over a specific period. It showcases key metrics such as daily sales, profit margins, costs, and tax data, all organized by date. These reports are crucial for understanding your business’s performance and identifying areas for improvement. By comparing sales data to historical trends or industry benchmarks, businesses can assess their progress and implement effective strategies.
WHY SALES REPORTS ARE IMPORTANT?
Sales reports are the backbone of your business strategy. They provide valuable information that helps you:
- Track Performance: Monitor daily, weekly, and monthly sales to identify trends and patterns.
- Optimize Inventory: Understand which products are selling well and which aren’t, so you can adjust your inventory accordingly.
- Improve Profit Margins: Analyze costs and revenues to find ways to increase profitability.
- Make Informed Decisions: Use data-driven insights to make strategic business decisions.
TYPES OF SALES REPORTS AND WHAT THEY TELL YOU
1. Sales Report
What it shows: Daily sales, profit margins, costs, tax data, refunds, surcharge, returns, mark-up along with net sales.
Why it’s useful: provide real-time insights into your business’s performance, helping you track profitability, manage costs, ensure tax compliance, and make data-driven decisions.
2. Sales by Category
What it shows: Sales data categorized by product category, including quantities sold, total revenue, expenses, and profit margins.
Why it’s useful: Helps you understand which categories are performing well and which need attention.
3. Sales by Product Report
What it shows: Sales data organized by product names and descriptions, including quantities sold, total revenue, expenses, and profit margins.
Why it’s useful: Offers detailed insights into the performance of individual products, helping you optimize inventory, pricing, and marketing strategies.
4. Sales by Discount Report
What it shows: Overview of products sold on discount, excluding order or manual price change discounts.
Why it’s useful: Helps you track the effectiveness of discount strategies and their impact on sales.
5. Sales by Sales Representative Report
What it shows: Sales, profit margins, costs, and tax data organized by sales representative.
Why it’s useful: Allows you to evaluate the performance of your sales team and identify top performers.
6. Settlement Report
What it shows: Date-wise breakdown of sales data, including customer details, payment methods, payment types, and total sales amount.
Why it’s useful: Provides a comprehensive view of sales transactions and helps in reconciling accounts.
7. Daily Cash Flow Summary Report
What it shows: Breakdown of transactions into key categories, including total sales, payments received, outstanding accounts receivable (AR) payments, and the balance of old and new AR payments.
Why it’s useful: Offers a clear view of your cash flow for a specific day, helping you manage finances effectively.
8. Payment Method Summary Report
What it shows: Total amount of payments received according to each payment method, customizable to specific customers and users.
Why it’s useful: Helps you understand payment preferences and manage payment processing efficiently.
9. Account Receivable for Date Report
What it shows: Overview of outstanding accounts, calculating the balance for each customer based on the total amount due and payments received up to the specified end date.
Why it’s useful: Provides an overview of outstanding invoices, helping you track overdue payments, manage credit risk, and optimize your billing processes.
10. Credit Card Reports
What it shows: Overview of credit card sales made.
Why it’s useful: Offer insights into fraud, customer demographics, and payment preferences, helping you protect your business and optimize your operations.
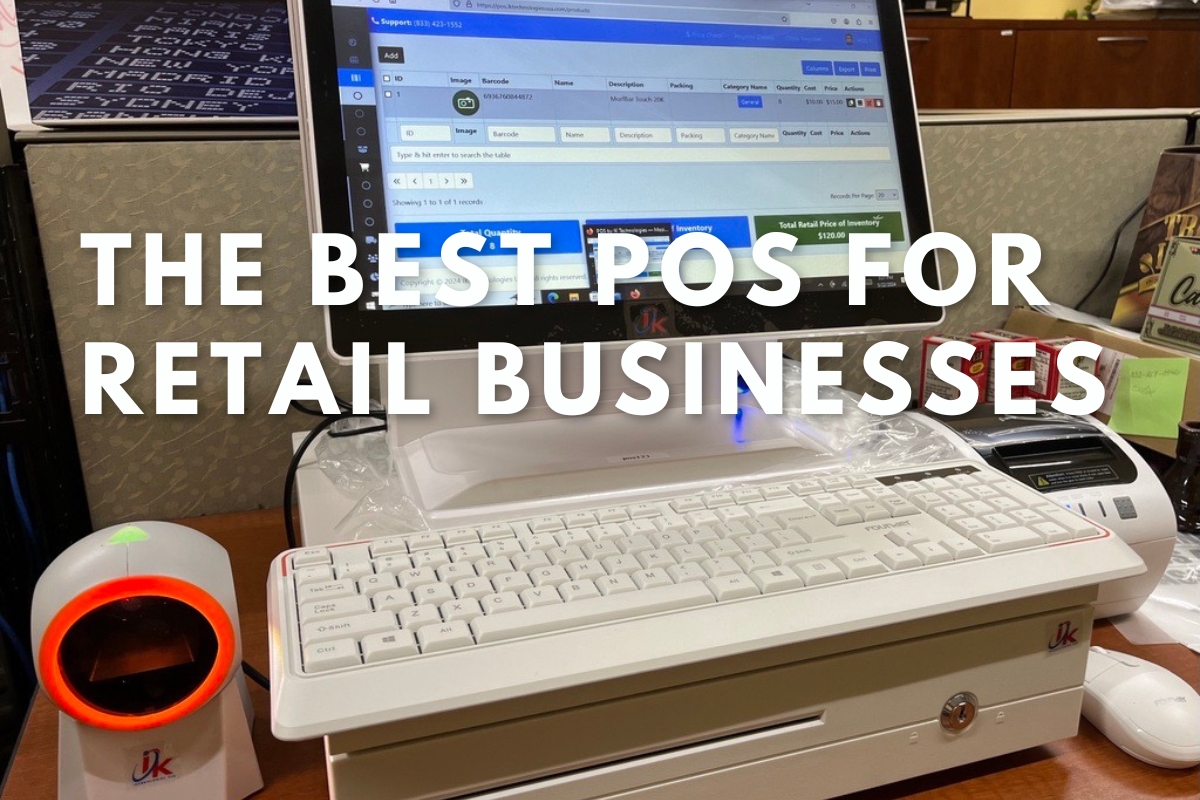
IK TECH POS: YOUR SALES REPORT SOLUTION
At IK Tech, we understand the importance of having comprehensive sales reports at your fingertips. Our POS system is designed to generate all these reports and more, providing you with the insights you need to drive your business forward.
With IK Tech’s POS, you can easily access detailed sales data, customize columns to your needs, and make informed decisions that boost your bottom line. What sets us apart is our unique ability to display both markup and margin in reporting—something you won’t find in any other POS system.
Ready to transform your business with powerful sales reports? Choose IK Tech’s POS system and take control of your sales data today!
Questions
Have you tried using these sales reports? Let us know how they’ve helped your business in the comments.